Customer Survey
& Archetypes
A quantitative research initiative leveraging advanced statistical analyses of large-scale survey data for the development of distinguished customer archetypes.
"Seriously so impressed with your ability to push this through despite the NUMEROUS setbacks, resistances, pivots etc. Rachael kept holding the vision and adapting and moving forward. LEGEND."
— Laura, Senior UX Researcher
"And on our original timeline to boot! EPIC!"
— Karin, Vice President of Design
The results are in.
Project overview
Opportunity
After years of developing the WM product with only one type of user in mind, the organization lacked understanding of who our customers actually are, how they shop, and what they need from a shopping experience.
Contribution
Responsible for designing and administering a large-scale customer survey, performing multivariate and cluster analyses, generating archetypes from the dataset, and presenting results to Product & Marketing teams and executive leadership.
Outcome
Robust quantitative customer insights and statistically distinct customer segments adapted to compelling user archetypes, which have been cross-functionally adopted and integrated into the collective product development process.
-
UX Research, Public Relations, Brand Marketing, Product Marketing, Product Management, UX Design
-
- Survey to gain quantitative insight from our current customer base
- Descriptive analysis to break down the dataset into percentiles and determine prominent characteristics across the sample
- Multivariate & regression analysis to identify patterns and measure relationships and between variables
- Cluster analysis to segment respondents into meaningful segments
-
Qualtrics, Excel, Figma, Google Workspace (Docs, Slides), Atlassian (Confluence, Jira)
Brand introduction
WM Technology (Weedmaps) is a cannabis tech company whose marketplace app connects medical and recreational cannabis consumers to brands, products, retailers, and healthcare providers. With a B2B2C operating model, Weedmaps also offers the cannabis retailer community a robust SaaS product suite that empowers ecomm and brick & mortar retail managers to scale their business through omnichannel advertising, marketing, operations, and branded ecommerce.
The challenge
The Weedmaps product was initially designed with a single type of user in mind, based on early assumptions and ideals. Since then, the Weedmaps customer base has grown and the industry has diversified considerably, and this narrow product focus restricted our ability to satisfy the varied needs of a broader audience and created a barrier for growth. In order to develop the product to serve the masses, we needed to understand the nuanced segments that comprised our user base.
Research plan
Our objectives were to understand and quantify the breadth of characteristics and patterns present within our current customer base, with a subsequent goal of developing customer archetypes that would generate empathy and understanding to guide strategic decision making going forward. A large-scale customer survey was the optimal choice of methodology for our objectives, given:
-
Surveys can reach a wide and diverse audience, ensuring that we capture inputs from various customer segments and avoid biases.
-
By asking targeted questions directly to our customers, we could gather firsthand information about their shopping habits, preferences, and needs.
-
Surveys allow for the collection of quantitative data, providing statistically significant insights into customer demographics, attitudes, and behaviors.
-
The survey results provide a baseline of customer insights that can be referenced in future research projects to track changes over time and measure strategic impact.
Survey design
I met with cross-functional stakeholders to capture the spread of information needs and archetype use cases, then drafted a multi-dimensional survey with question structures including multiple choice, semantic differential, rank-order, and some open-ended response, with skip logic and conditional branching built in to ensure wording and flow would be appropriate for each participant based on their individual responses. Survey questions covered five key segmentation categories:
Demographic
Attributes & characteristics, such as age, gender, and geographic location
Behavioral
Purchasing & usage habits, such as purchase method, spend, and frequency
Psychographic
Attitudes & interests, such as purchase considerations and product priorities
Competitive
Preferences & comparison, such as experiences with and opinions of competitors
Inactive customer
Lapsed & abandoned, shown only to those who have not purchased in 3+ months
I socialized the question draft for stakeholder alignment and submitted to Legal for sign-off, then built the survey & logic in Qualtrics and applied the screener. Once the preview was generated, I recruited the UX Design team to stress-test for optimal comprehension and functionality.
Execution strategy
It was crucial that we hear from our current or recently-lapsed customers so that the data accurately represented our audience. With the benefits outweighing the risks, we decided to administer the survey via email.
Targeting
-
Wide reach with our own customers (email file exceeds 3 million individual users)
Owned channel: no additional cost to distribute
Allows the possibility to hear from lapsed or churned customers (branch to inactive customer survey questions)
Little risk of interrupting a current shopping session
Can send email reminder if needed
-
Sample is limited to marketing email opted-in customers, who may have different characteristics vs. the opted-out segment
Low response rate relative to more targeted methods
Certain segments may be more or less effectively incentivized
Potential for email marketing opt-outs
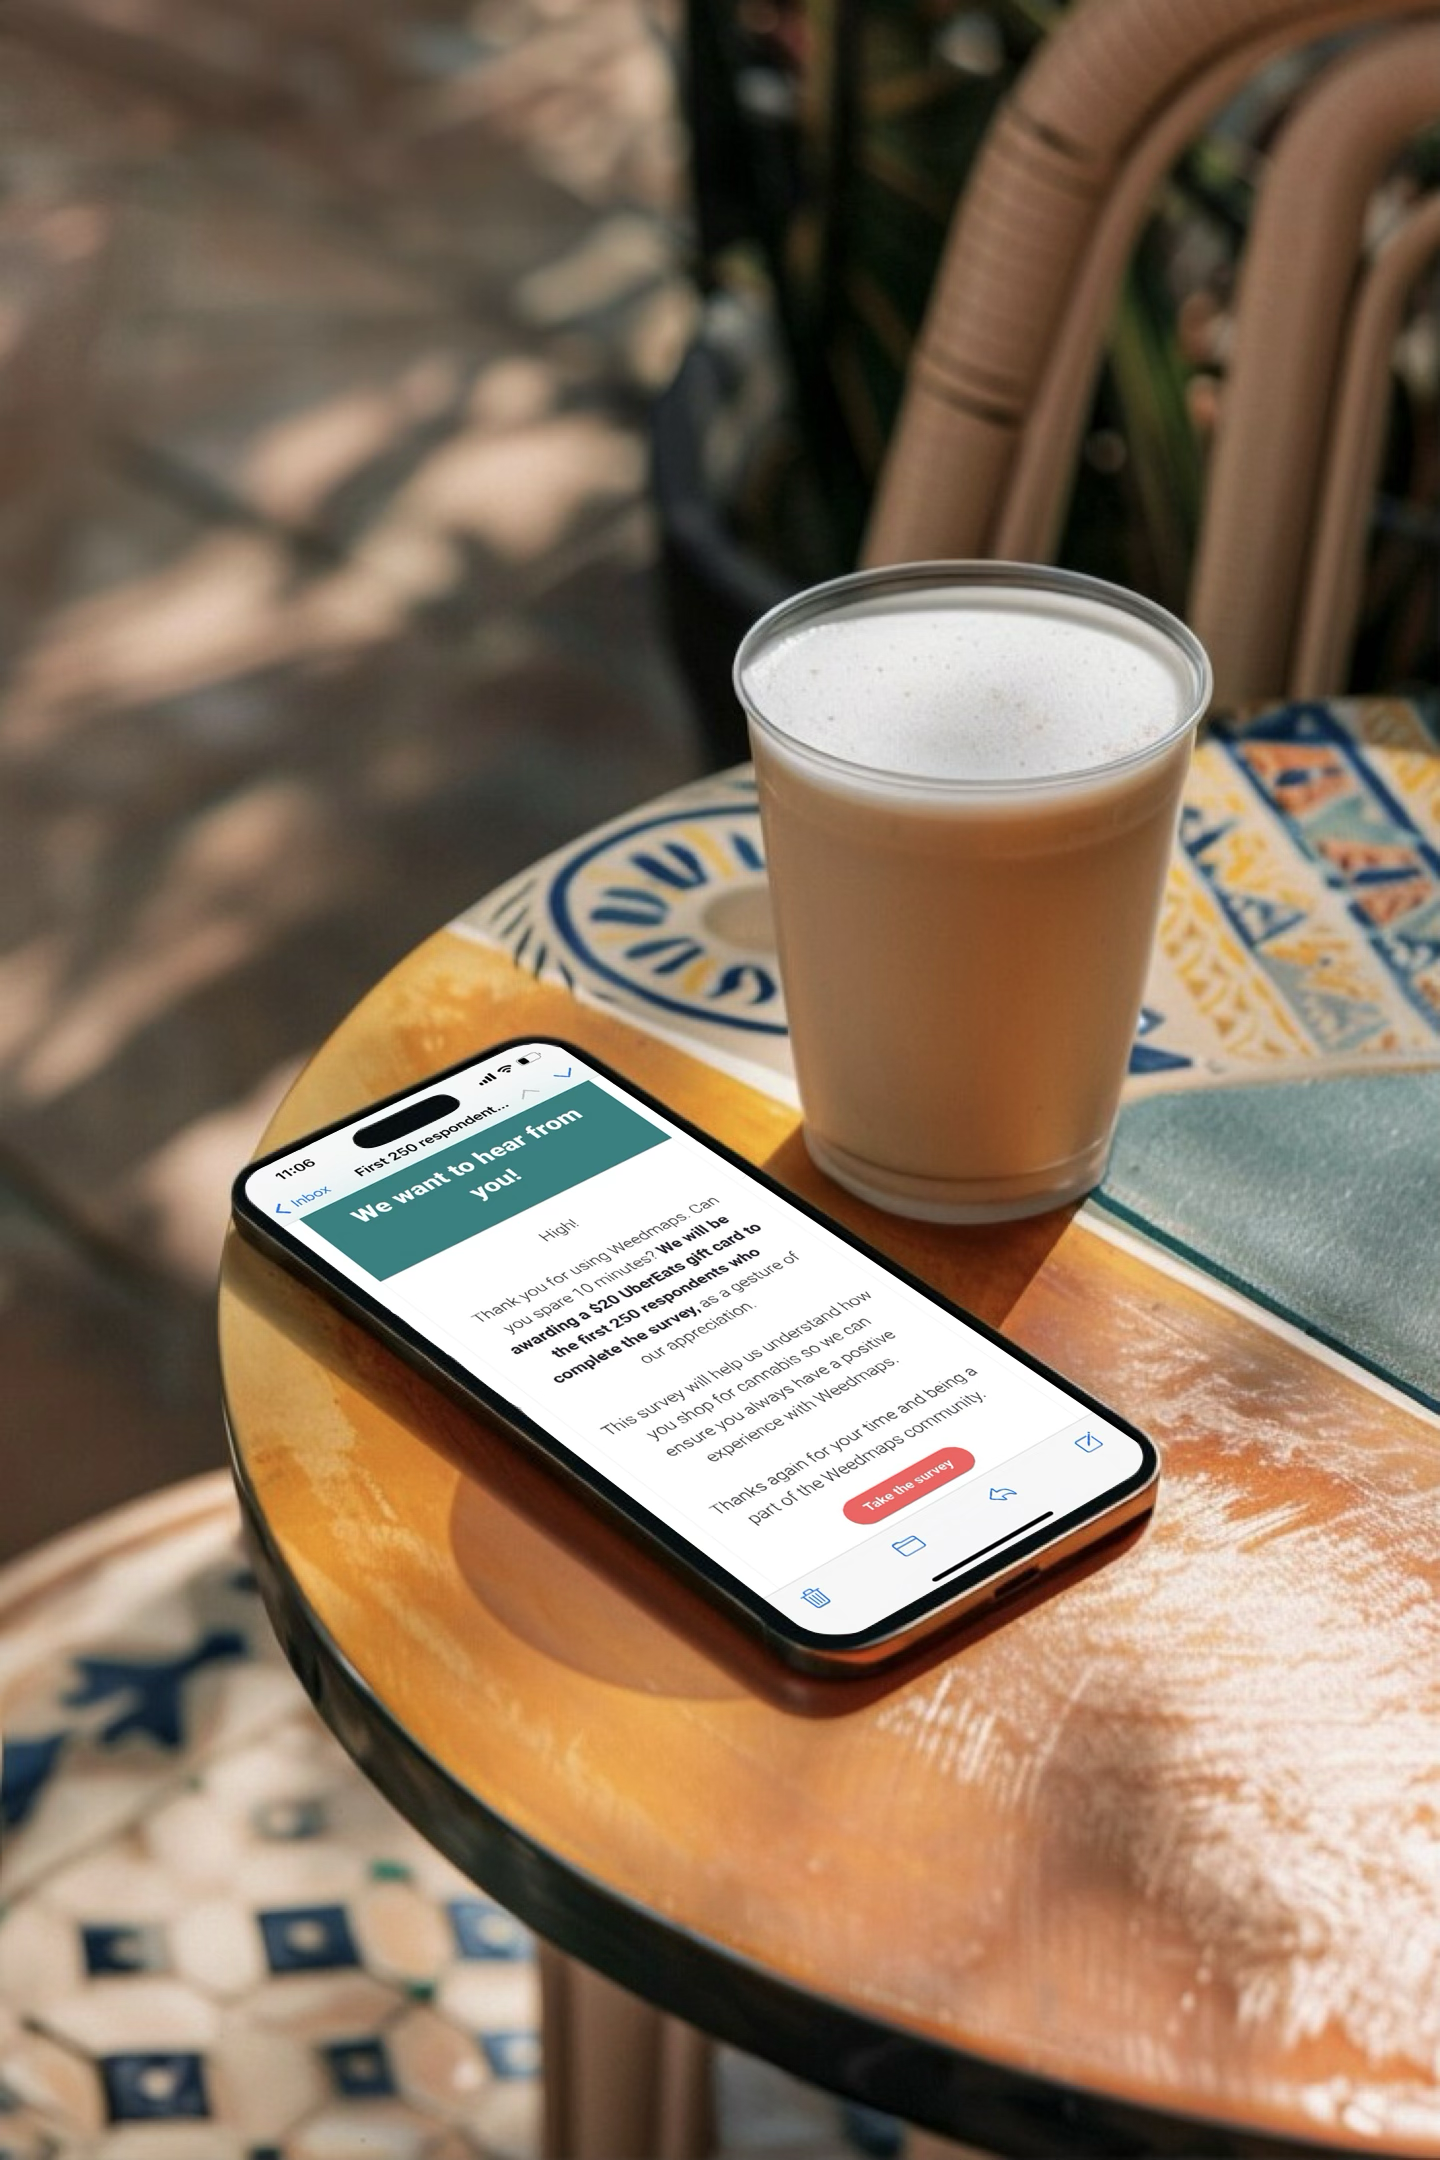
With a Finance-approved budget of $5k, I partnered with Legal and Marketing to determine an incentive strategy that would create urgency, optimize perceived chances of “winning,” balance reward value with availability, and avoid regulatory hurdles. We opted to reward the first 250 respondents with a $20 gift card.
Incentive
Data collection
1.4M
survey invitation emails delivered
6.1%
response/open rate, > industry standard
12k
responses within 4 hours
22k+
total responses, exceeding goal by 7k
52%
completion rate, +73% vs. benchmark
15m
avg. duration
Data analysis
After 5 days of response sourcing (giving all invitees a fair chance to participate), I QAed the dataset to eliminate unreliable responses and began conducting a thorough quantitative analysis of 16.3k viable responses using three key statistical methods:
Descriptive analysis to summarize the data in terms of percentages & averages and compare to historical data.
Multivariate regression analysis to identify trends & patterns and measure the strength of relationships between variables.
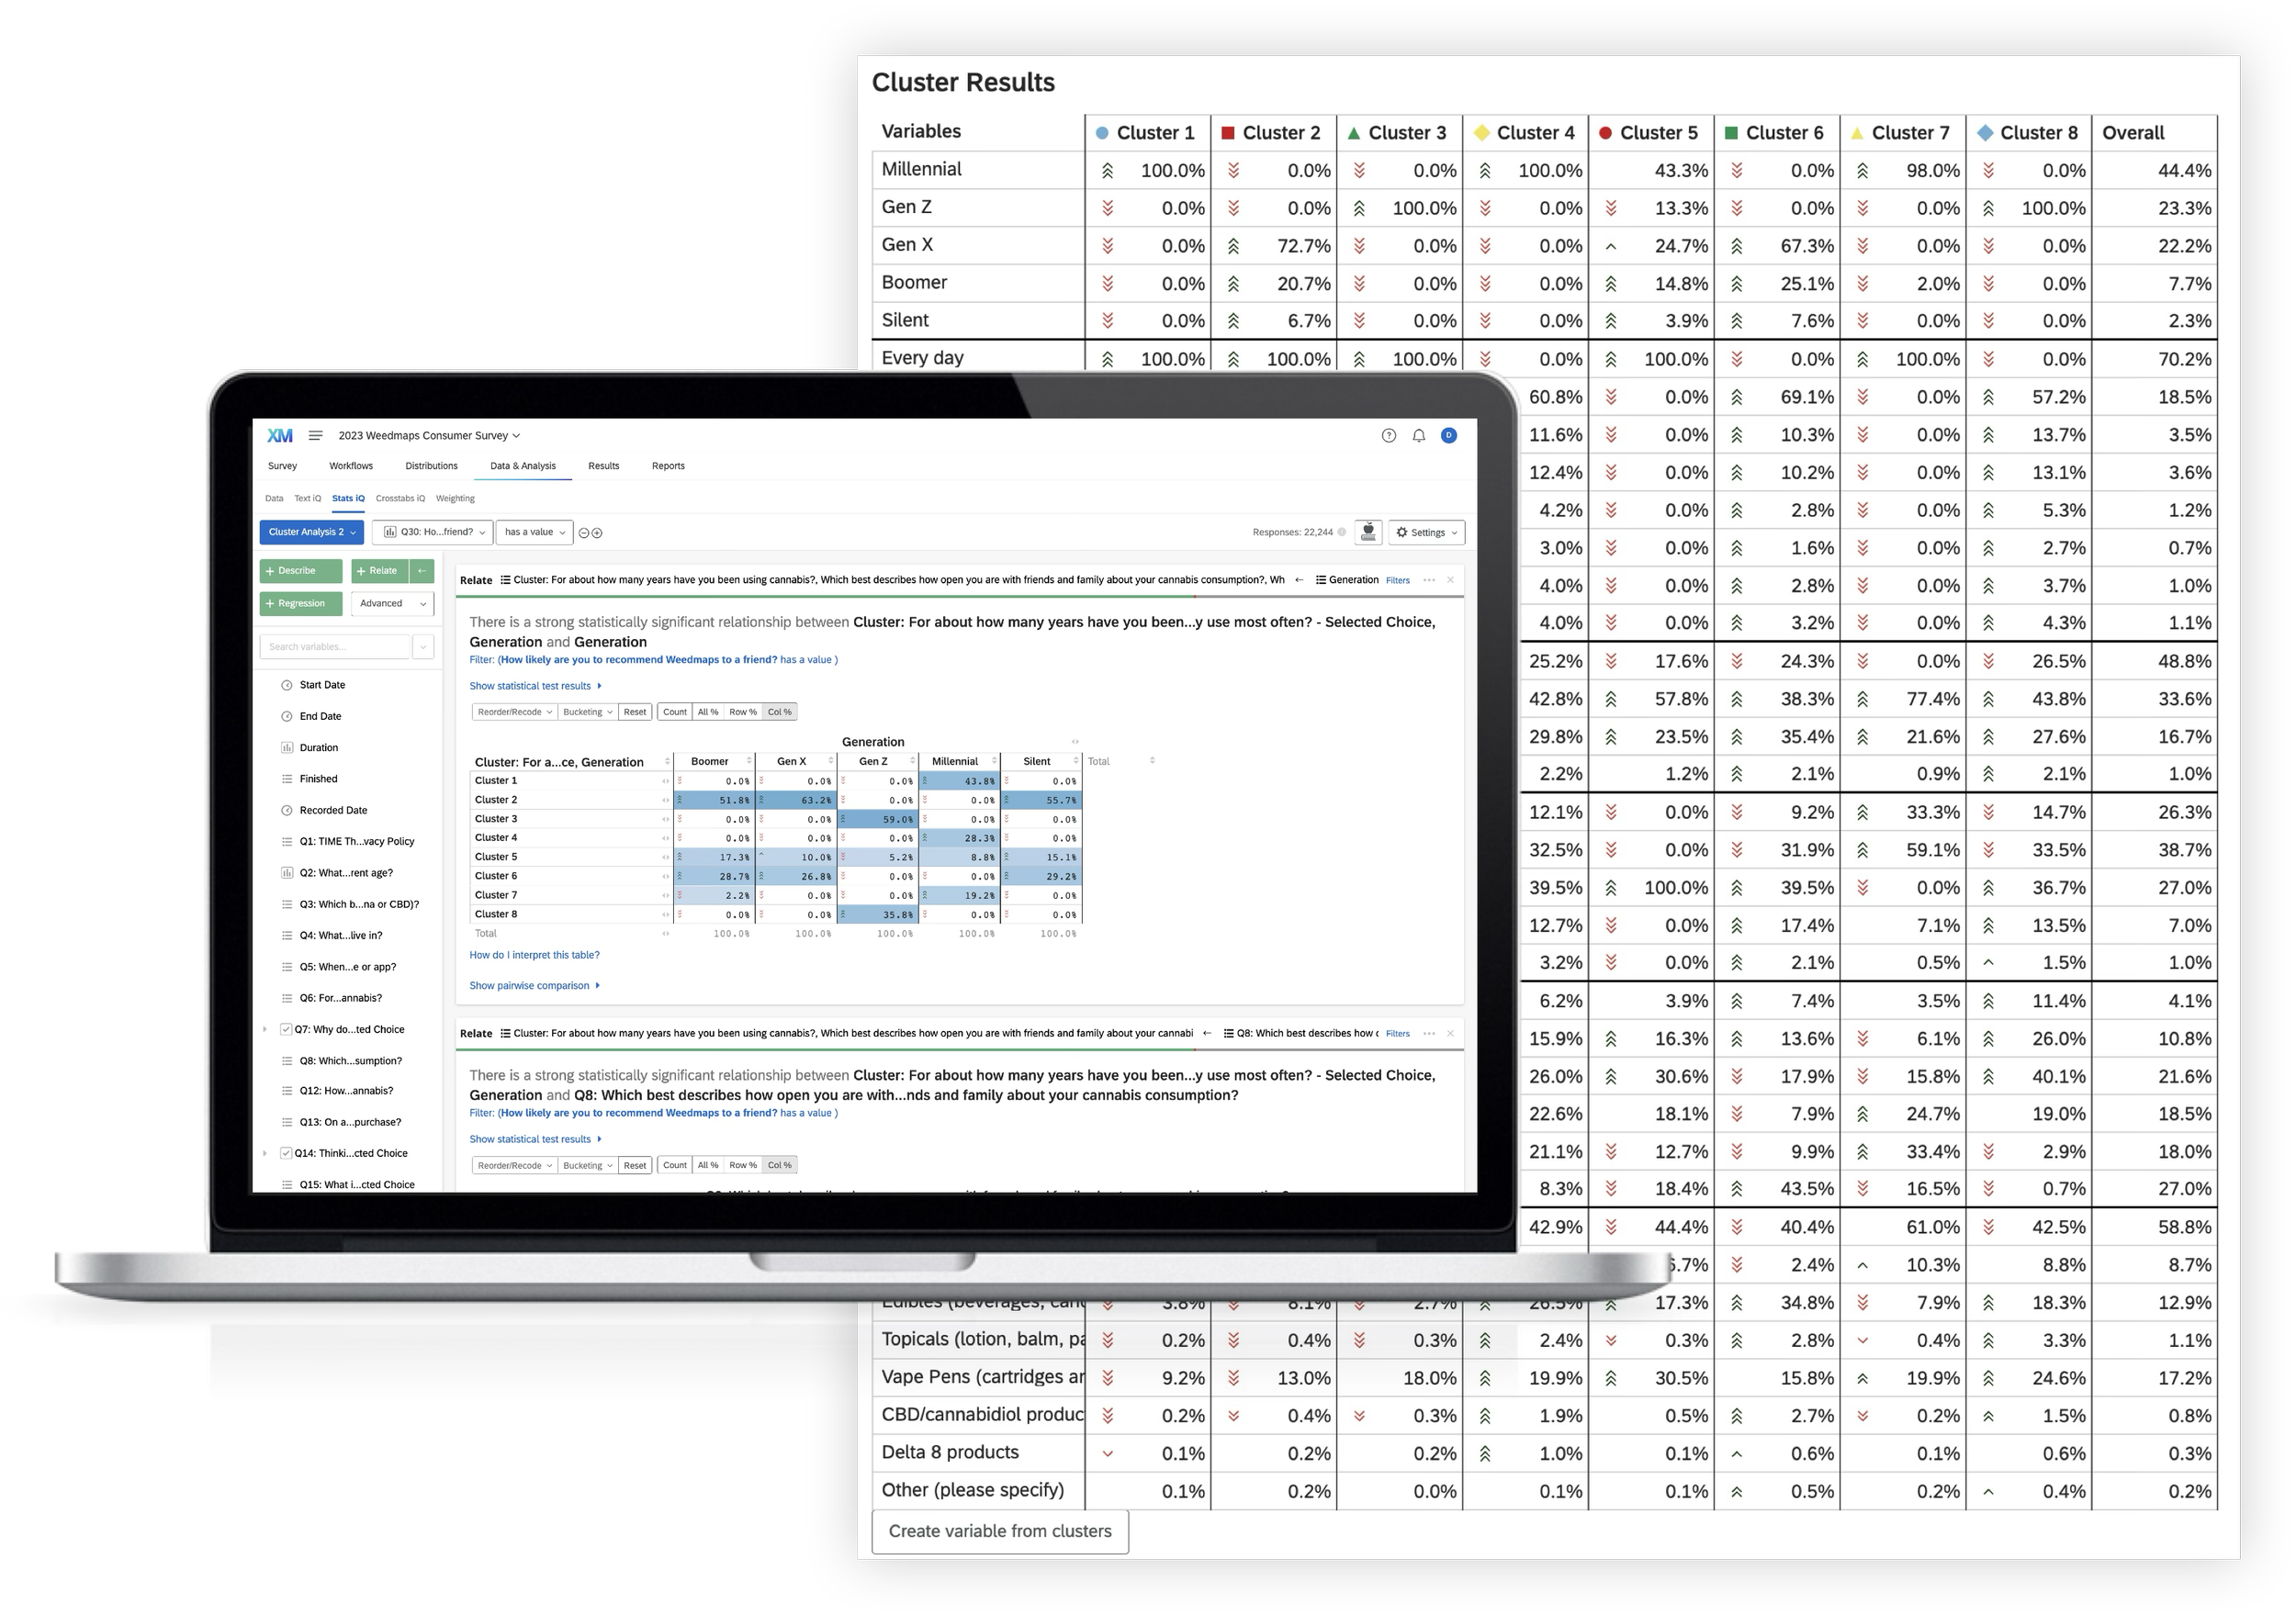
Cluster analysis to sort respondents into groups and refining to maximize silhouette score, ultimately informing archetypes.
Sample of output; insights have been modified for confidentiality.
Final deliverable
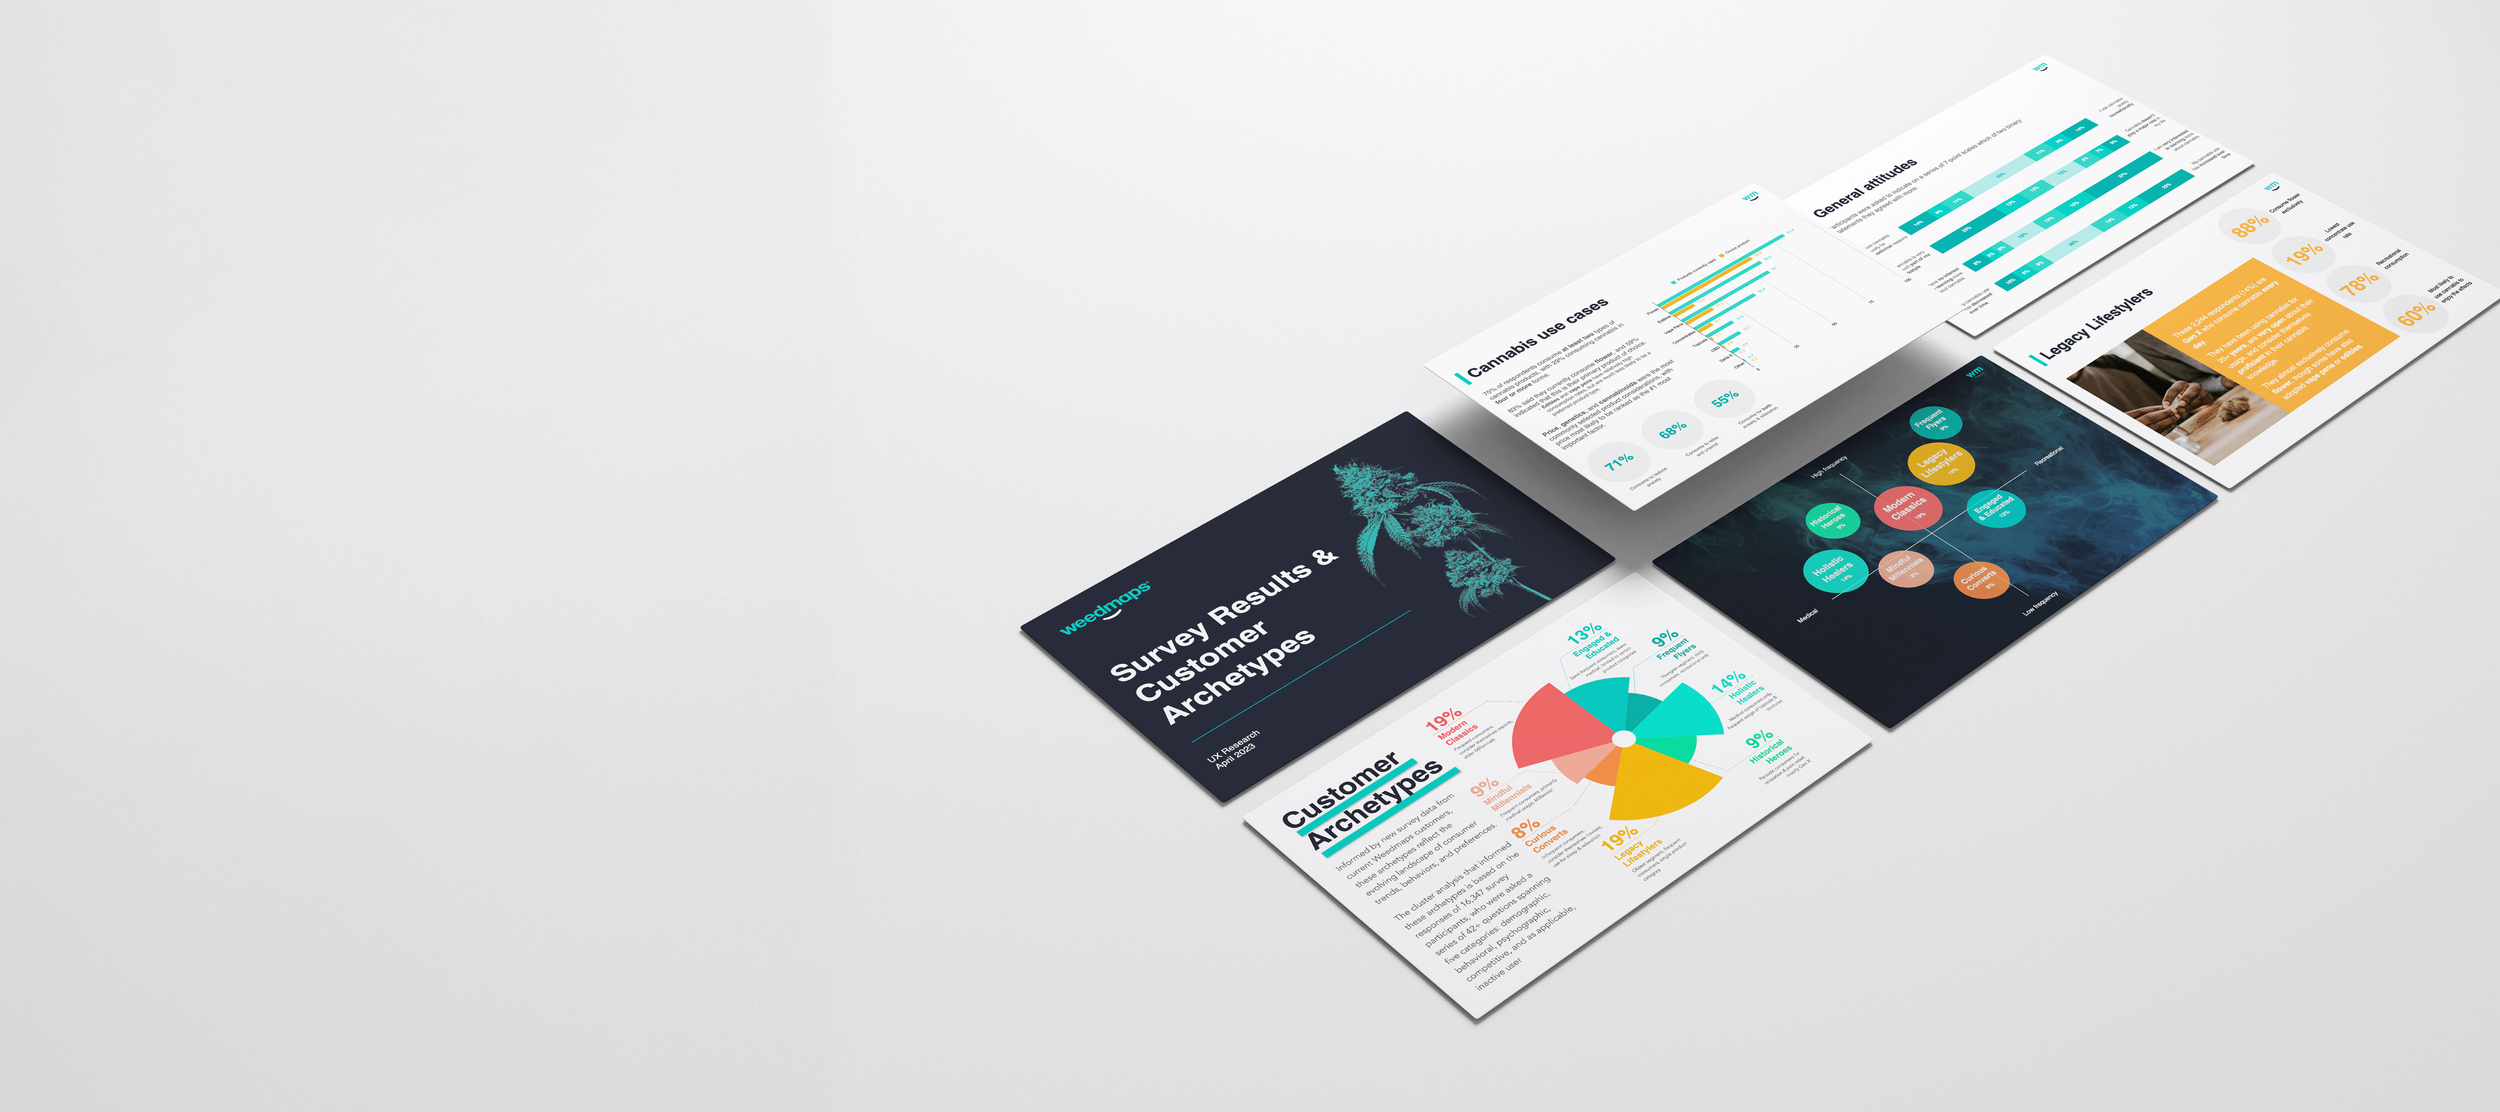
I developed an all-inclusive, 45-slide deck of survey results and analyses as the primary artifact of this study, pulling out key insights mapping back to our original research objectives and detailing the unique characteristics of each archetype. After reviewing with key stakeholders and the executive team, I was invited to present the insights and introduce the archetypes at a Tech All-Hands to an audience of more than 500 associates within Product, Design, Marketing, and Engineering.
Outcome & impact
The survey unlocked hundreds of statistical insights and yielded robust and compelling customer archetypes that have been adopted company-wide as a foundational tool for customer-centered strategy.
My quantitative data analyses surfaced key customer attitudes and behaviors and uncovered the strongest drivers of customer satisfaction and retention, enabling teams to prioritize high-impact product enhancements and marketing strategies backed by clear, data-driven evidence. This study has also generated demand for further geographical segmentation as well as repetition within the B2B domain.


